在使用 zabbix 的过程中,随着时间的推移,数据库中的历史数据会越来越多,会发现打开页面,查询数据等会变慢。zabbix 自带的 housekeeper 会定时清理(默认一小时清理一次)旧的数据。不过在 housekeeper 清理过中,会导致数据库负载极具增加。这里介绍另外一种办法,就是对几个历史数据表做分区表(partition table)可按照时间(每天)为维度,把历史数据存到各个分区表中,这样做有以下好处:
1.加快查询速度
2.快速清理过去一时间的历史数据(删除分区表)
配置
这里以 zabbix3.4 版本为例。使用 itnihao 的脚本即可(本人做了稍加修改)
zabbix 2.2 分区脚本
https://dl.cactifans.com/zabbix/partitiontables.sh
zabbix3.4 及以上版本分区脚本
https://dl.cactifans.com/zabbix/partitiontables_gt_zbx34.sh
下载脚本到并赋予可执行权限,默认脚本详情数据保留 30 天,趋势数据保留 12 个月,可根据实际情况修改。修改脚本以下地方即可
1
2
|
daily_history_min=30
monthly_history_min=12
|
脚本里默认的 zabbix 数据库主机为 localhost,用户为 zabbix,密码为 zabbix,如果你的信息不是这个,可以修改脚本里的如下对应信息
1
2
3
|
DBHOST=localhost
DBUSER=zabbix
DBPASS=zabbix
|
修改好之后,赋予可执行权限。
分区
注意:执行分区表之前建议先停止 zabbix server,如果不停止可能导致意外事件,备份好 zabbix server 数据库。因此建议安装好 zabbix server 之后就进行分区表。
1
|
./partitiontables_gt_zbx34.sh
|
完整执行过程如下
1
2
3
4
5
6
7
8
|
[root@localhost opt]# ./partitiontables_gt_zbx34.sh
Ready to partition tables.

Ready to update permissions of Zabbix user to create routines

Enter root DB user: root
Enter root password: root
Warning: Using a password on the command line interface can be insecure.
|
以上要输入数据库的 root 用户和 root 密码
1
2
3
|
Do you want to backup the database (recommended) (Y/n): n
Are you certain you have a backup (y/N):
y
|
是否需要备份数据库,这里我选 n(之前备份过)
是否确认已经备份,y
1
2
3
4
5
6
7
|
Ready to proceed:

Starting yearly partioning at: 2018
and ending at: 2018
With 30 days of daily history
Ready to proceed (Y/n):
y
|
分区表基本信息,确认执行
 1
 2
 3
 4
 5
 6
 7
 8
 9
10
11
12
13
14
15
16
17
18
19
20
21
22
23
24
25
26
27
28
29
30
31
32
33
34
35
36
37
38
39
40
41
42
43
44
45
46
|
Altering table: history
Altering table: history_log
Altering table: history_str
Altering table: history_text
Altering table: history_uint
Altering table: trends
Altering table: trends_uint
Creating monthly partitions for table: trends
Creating monthly partitions for table: trends_uint
Creating daily partitions for table: history
Creating daily partitions for table: history_log
Creating daily partitions for table: history_str
Creating daily partitions for table: history_text
Creating daily partitions for table: history_uint


Ready to apply script to database, this may take a while.(Y/n):
y
Warning: Using a password on the command line interface can be insecure.
Altering tables
history
history_log
history_str
history_text
history_uint
trends
trends_uint
trends
trends_uint
history
history_log
history_str
history_text
history_uint
Installing procedures

If Zabbix Version = 2.0
Do you want to update the /etc/zabbix/zabbix_server.conf
to disable housekeeping (Y/n): n
Do you want to update the crontab (Y/n): y
The crontab entry can be either in /etc/cron.daily, or added
to the crontab for root

Do you want to add this to the /etc/cron.daily directory (Y/n): y

Enter email of who should get the daily housekeeping reports: test@126.com
|
如果无错误,表示分区表创建成功。
确认
查看/etc/cron.daily/目录下是否有 zabbixhousekeeping 脚本,内容为
1
2
|
#!/bin/bash
/usr/local/zabbix/cron.d/housekeeping.sh
|
查看 housekeeping.sh 脚本,内容如下
 1
 2
 3
 4
 5
 6
 7
 8
 9
10
|
#!/bin/bash

MAILTO=test@126.com
tmpfile=/tmp/housekeeping$$

date >$tmpfile
/usr/bin/mysql --skip-column-names -B -h localhost -uzabbix -pzabbix zabbix -e "CALL create_zabbix_partitions();" >>$
tmpfile 2>&1
/usr/bin/mail -s "Zabbix MySql Partition Housekeeping" $MAILTO <$tmpfile
rm -f $tmpfile
|
每次分区大约在每晚凌晨 3 点左右执行,执行成功后,脚本会用 mail 程序把执行结果发送到上面的邮箱,如果不需要可以删除 mail 一行即可。
邮件内容大概如图
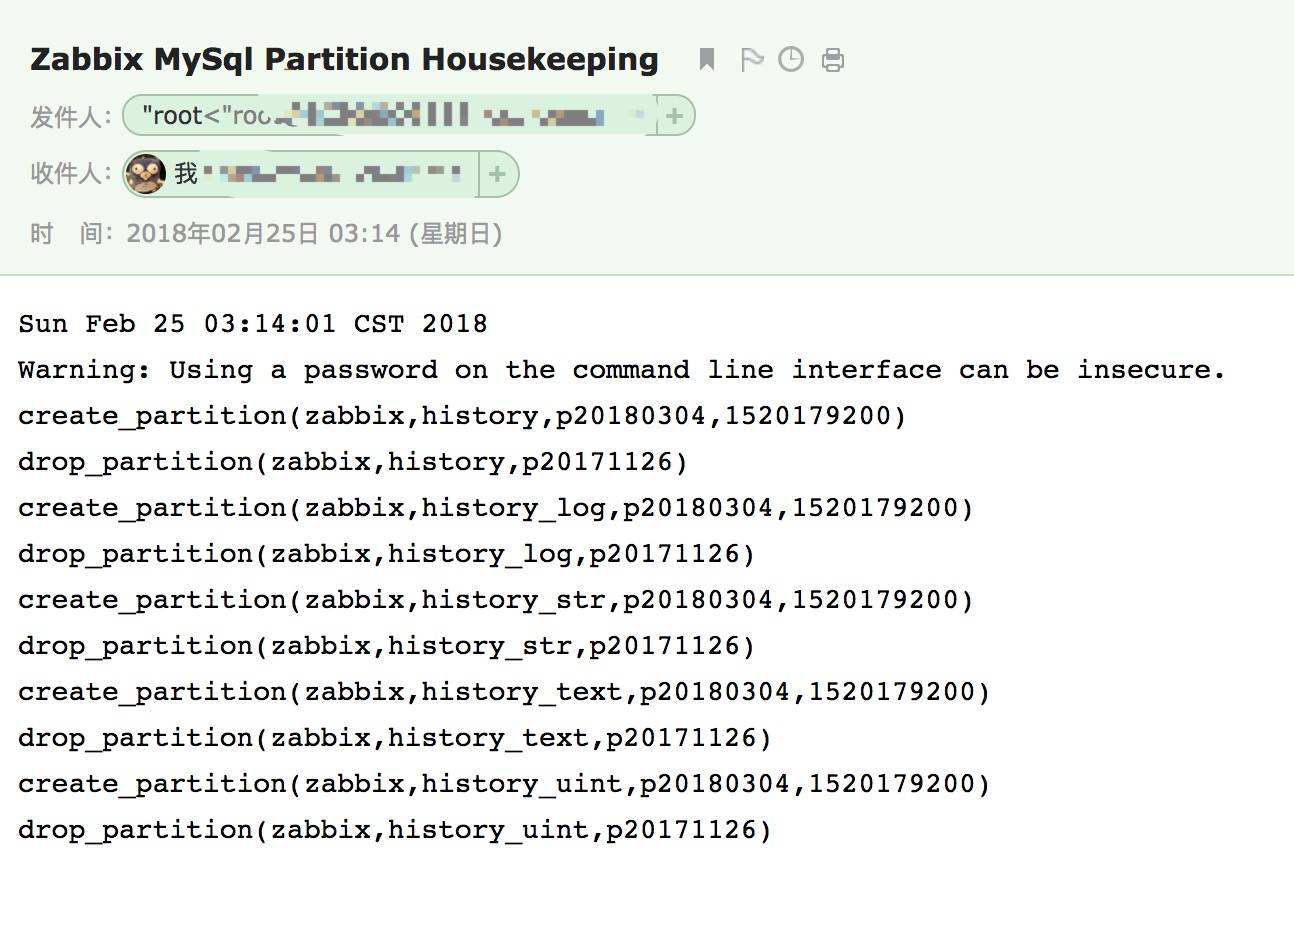 即可看到删除过期的数据分区表,并建立新的分区表。
查看
如果要具体查看分区表的情况,可以进入 zabbix 数据库,执行以下 SQL 语句查看 histroy 表的分区情况
1
2
3
4
5
6
7
8
9
|
use zabbix;
select
  partition_name part,
  partition_expression expr,
  partition_description descr,
  table_rows
from information_schema.partitions  where
  table_schema = schema()
  and table_name='history';
|
结果如下
 1
 2
 3
 4
 5
 6
 7
 8
 9
10
11
12
13
14
15
16
17
18
19
20
21
22
23
24
25
26
27
28
29
30
31
32
33
34
35
36
37
38
39
40
41
42
43
|
+-----------+--------+------------+------------+
| part      | expr   | descr      | table_rows |
+-----------+--------+------------+------------+
| p20180126 |  clock | 1516982400 |          0 |
| p20180127 |  clock | 1517068800 |          0 |
| p20180128 |  clock | 1517155200 |          0 |
| p20180129 |  clock | 1517241600 |          0 |
| p20180130 |  clock | 1517328000 |          0 |
| p20180131 |  clock | 1517414400 |          0 |
| p20180201 |  clock | 1517500800 |          0 |
| p20180202 |  clock | 1517587200 |          0 |
| p20180203 |  clock | 1517673600 |          0 |
| p20180204 |  clock | 1517760000 |          0 |
| p20180205 |  clock | 1517846400 |          0 |
| p20180206 |  clock | 1517932800 |          0 |
| p20180207 |  clock | 1518019200 |          0 |
| p20180208 |  clock | 1518105600 |          0 |
| p20180209 |  clock | 1518192000 |          0 |
| p20180210 |  clock | 1518278400 |          0 |
| p20180211 |  clock | 1518364800 |          0 |
| p20180212 |  clock | 1518451200 |          0 |
| p20180213 |  clock | 1518537600 |          0 |
| p20180214 |  clock | 1518624000 |          0 |
| p20180215 |  clock | 1518710400 |          0 |
| p20180216 |  clock | 1518796800 |          0 |
| p20180217 |  clock | 1518883200 |          0 |
| p20180218 |  clock | 1518969600 |          0 |
| p20180219 |  clock | 1519056000 |          0 |
| p20180220 |  clock | 1519142400 |          0 |
| p20180221 |  clock | 1519228800 |          0 |
| p20180222 |  clock | 1519315200 |          0 |
| p20180223 |  clock | 1519401600 |          0 |
| p20180224 |  clock | 1519488000 |          0 |
| p20180225 |  clock | 1519574400 |        204 |
| p20180226 |  clock | 1519660800 |          0 |
| p20180227 |  clock | 1519747200 |          0 |
| p20180228 |  clock | 1519833600 |          0 |
| p20180301 |  clock | 1519920000 |          0 |
| p20180302 |  clock | 1520006400 |          0 |
| p20180303 |  clock | 1520092800 |          0 |
| p20180304 |  clock | 1520179200 |          0 |
+-----------+--------+------------+------------+
38 rows in set (0.00 sec)
|
可以看到已经按照事件维度分区,和表中数据行数,分区表成功。
如果觉得我的文章对您有用,请关注我的公众号,有更多技术干货!